Help - Detailed
Here's a link to a description of DevWareX new features.
1. Welcome to DevWareX

Application setup:
Installation(See 2.1.1)
Running the Application(See 2.1.2)
Application layout and options:
Menu Commands(See 2.2.1)
Toolbar Buttons(See 2.2.2)
Display Screen (See 2.2.3)
Main Dialogs:
Info Dialog (See 2.2.5)
Sensor Control Pages(See 2.2.4)
Presets Dialog (See 2.2.6)
Register Dialog(See 2.2.7)
Register Log Dialog(See 2.2.8)
Analysis Graph Dialog(See 2.2.9)
Magnifier(See 2.2.10)
Peek & Poke(See 2.2.12)
Watch Dialog (See 2.2.13)
Embedded Data Viewer(See 2.2.14)
Options Dialog (See 2.2.15)
Troubleshooting:
Warning Messages(See 2.2.16)
Troubleshooting(See 2.2.17)
Reporting a Bug(See 2.2.18) (mail to: Aptina-IMAGING_DEMO_BUGS@onsemi.com)
2. DevWareX Help
2.1 Using the Application
2.1.1 Installation
Please refer to the document titled "DevSuite Quick-Start Guide", found in the "doc" folder and through the "Docs" shortcut.
2.1.2 Windows XP / 2000: Running the Application
It is best to read through and follow the instructions in the "DevSuite Quick-Start Guide" as to the proper sequence of installation and running of the DevSuite software.
After installing the software, use the following instructions to install the USB driver.
- Plug the kit into your computer using a USB cable. After a few seconds, your computer should detect new hardware and start the "Found New Hardware Wizard" application to prompt you for the location of an appropriate USB driver. Please follow the instructions found in DevWareX USB Drivers User Guide and then the USB XP Driver User Guide.
- When completed, you will able to run the DevSuite software.
The program can now be opened by going to the start menu and selecting "Programs" then "Aptina Imaging" then "DevWareX". A popup window will appear while DevWareX probes for attached devices. Then the main DevWareX window and a dialog box will appear that is slightly different for each sensor. Select the appropriate settings and click finish. Unless an error occurs(See 2.2.17) the application will open the display dialog and start capturing and displaying sensor images.
Note: Sensor data files can be manually loaded. Click the esc key to exit automatic probe. Make sure that the box next to "Automatically probe at startup" is unchecked. Click on "Sensor..." to browse for the corresponding sensor data (sdat) file. The file will be found in C:\Aptina Imaging\sensor_data.
2.1.3 Windows 7 / Windows Vista: Additional Information
DevSuite is ready to use on the Vista and Windows 7 operating systems when installed in the correct folder, but there is a requirement that the Demo2X demo board have a FW version of 28 or newer to match to the USB driver.
Note; the Demo3 FW is already Windows 7 compatible.
Firmware Upgrade
Note that a demo board with FW older than version 28 can only be upgraded on an XP operating system since only the XP-based USB driver supports the older versions of the FW. As of May of 2010, all newly delivered Demo2X boards will have version 28 of the FW. Demo2X boards received earlier than that may have an older FW version, and the FW version should be verified on an XP-based system before proceeding.
If you aren't sure that your FW has version 28 or newer, install the DevSuite SW on an XP-based system by following the instructions thru the section titled "Starting Up the Software" as found in "DevSuite Quick-Start Guide", which can be accessed from the DevWareX menu item "Documents". Then follow the FW upgrade instructions as found in "Demo FW User Guide", which can be accessed from the DevWareX menu item "Documents -> User Guides".
If you are fairly sure that your FW has version 28 or newer, then install the DevSuite SW on your Vista or Windows 7-based system by follow the instructions thru "Starting Up the Software" section of the Quick-Start guide. Once the USB cable is connected to the Demo2X demo board, Vista and Windows 7 will automatically attempt to download the matching USB driver from the Microsoft driver web site; if the driver installs correctly then your FW is current and no further action is required - continue with the instructions found in the Quick-Start guide.
If the USB driver download fails, it is either due to downgraded FW or a network problem. You can attempt to load the USB driver manually by following the instructions in the "Aptina Drivers User Guide", which can be accessed from the DevWareX menu item "Documents -> User Guides".
If the USB driver installs correctly then your FW is current and no further action is required - continue with the instructions found in the Quick-Start guide.
If the USB driver manual load failed, you will need to use an XP-based operating system to upgrade your Demo2X demo board as described earlier in this document.
Software Installation
Do not install DevSuite in "C:\Program Files", due to the strict system security checking performed by Vista and Windows7.
The installer defaults to the recommended installation location of "C:\Aptina Imaging". If necessary this can be changed when prompted for the installation location.
2.1.4 Windows 8: Additional Information
onsemi will not be getting the USB drivers certified to run on Windows 8. In the mean time, please follow the instructions in Windows8 USB3 Driver Usage instructions to be able to install and enable the drivers.
2.1.5 Windows 10: Additional Information
These USB drivers are certified, so once you plug in the Demo plug-and-play should download and installer the driver. If not, follow the instructions in Windows10 USB3 Driver Usage instructions.
2.1.6 Command Line Parameters
Command line parameters can be used with DevWareX.
Usage
Open a "CMD" window, navigate to the installation folder of C:\Aptina Imaging, and provide any of the following parameters.Note that parameters can be in all upper-case or all lower-case, and can be provided in any order.
devwarex [/help | ?] [/ini=["]filename["]] [/preset=["]name["]] [/camera=decimal number] [/probe=0 | 1] [/fullauto[=0 | 1]] [/mono[=0 | 1]][/play[=0 | 1]] [<sensor_sdat_file>.xsdat] [/nul]
- /help or ? - Display this page. You are given the option to continue to DevWareX or to exit. Note: if "?" is used, all other parameters are ignored.
- /ini=filename or /ini="filename" - Specify the INI file to be used, overriding the one selected by DevWareX if "Probe" is enabled.
- /preset[=name] or /preset[="name"] - Run the optionally supplied specified preset. Note that the Startup Wizard dialog will be skipped whether or not the preset name is supplied.
- /checksensor[=0 | 1 (default if not supplied)] - Disable | Force reading of sensor registers at startup. Disabled gives faster startup.
- /camera=<number in decimal> - Force a specific camera id selection, in case more than one camera was detected.
- /probe[=0 | 1 (default if not supplied)] - Disable | Force a "Probe". Note: ignored if SDAT filename is provided, and no "Probe" is performed if the parameter itself is not supplied.
- /fullauto[=0 | 1 (default if not supplied)] - Disable | Force "Full Auto" option on the Startup Wizard. Note: enabled if parameter itself is not supplied.
- /mono[=0 | 1 (default if not supplied)] - Disable | Force "Monochrome" option on the Startup Wizard. Note: disabled if parameter itself is not supplied.
- /play[=0 | 1 (default if not supplied)] - Disable | Force "Play on Start" option on the Startup Wizard. Note: enabled if parameter itself is not supplied.
- <sensor_sdat_file>.sdat - Specify the SDAT file to be used, overriding the one selected by DevWareX if "Probe" is enabled.
- /nul - start without HW needing to be attached. An SDAT file can be loaded, and Presets can be run as long as it doesn't expect register reads to provide valid data.
- /detfar - detect FAR sensor on start.
- /warnings=filename - Specify the warnings file name.
- /restorepresets - 1 to restore the additional Presets windows from the last session, 0 to not restore the windows.
- /suppressallwindows - Start DevWareX will all windows suppressed - only the image display is enabled.
- /startfullscreen - Start DevWareX in full screen mode.
- /dll=DLLname. Include a new Transport DLL. And alternative is to copy the DLL to the Plugins folder.
- <sensor_sdat_file>.xsdat - if opening an .xsdat file with no directory path given and the file doesn't exist, the sensor_data directory will be searched.
2.2 Application Layout and Options
2.2.1 Menu Commands
File(See 4.2) | Sensor handling functions. |
| Edit(See 4.9) | Image and Preset Edit Options |
View(See 4.6) | Toolbars and dialogs. |
Plug-ins(See 2.2.1.1) | Activate plug-in dialogs (the contents of this menu vary). |
Command(See 4.1) | Commands like Play, Pause and Reset. |
| User Toolbar | Lists all of the Custom Toolbars for the currently-active INI file |
Select(See 4.4) | Mouse selection (used with the Analysis Dialog). |
| Documents(See 4.8) | Relevant Documents |
Help(See 4.3) | Access the help library. |
2.2.1.1 About Plug-ins
Introduction
The DevWareX application framework includes the ability to extend and customize its behavior. Two types of extensions are supported:
- Dialog Plug-in - a dynamically linked library (DLL) which can be integrated with DevWareX and can be used to:
- Display custom user interfaces.
- Access and run DevWareX INI presets.
- Access sensor registers.
- Process the image data.
For details on how to write your own dialog plug-ins, refer to the document DevWare Plugin Development Guide. You can also refer to a fully functional implementation example under the folder samples\DialogDLL.
- Midlib Transport DLL - a DLL which can be integrated with the midlib library in order to create a "driver" for midlib/DevWareX in order to support new devices. With a midlib Transport DLL you can:
- Support an ON Semiconductor sensor on a device other than the Demo System camera so DevWareX or any other midlib-based application will work with the device.
- Create a software simulated camera and sensor, simulating either an existing sensor or new sensor, and be able to use DevWareX as the user interface for the simulation.
For details on how to write your own midlib transport DLLs, refer to the document Midlib Transport Interface. You can also refer to a fully functional implementation example under the folder samples\TransportDLL.
Shipping Plugins
The DevSuite plug-ins and transport DLL's are located under the Plugins folder of your installation. Below is the list of items under the Plugins folder that are shipped in DevSuite:
Module name "*" = separate User Guide | Description |
| ActiveAlignment.dll | Interfaces with Matlab scripts to give dynamic plotting of x, y z, alpha, beta and theta values to help with lens positioning. Details are here. |
| AwbTuningMap.dll | For ICP2 (AP1300) and ICP3 (AP1302), this plug-in is used for advanced AWB tuning. |
| DemoTune.dll * | This plug-in automates the Lens Shading Correction process. |
Dewarp.dll * | Dialog plug-in for lens warping correction (Dewarp) of wide angle lenses. This module is loaded only with MT9V126/128 (MI-356SOC) and ASX344. |
| FocusModuleUniversalDlg.dll * | This plug-in implements manual and automatic focus on non-SOC sensors and modules. |
| GainExposureSweep.dll | Allows a sweep of a set of exposures for a given number of gain settings, along with option to capture images. |
| HorizontalDistortionCorrectionDlg.dll | For ASX353, plot distortion for lens profiles correction. |
| HostCommandInterface_plugin.dll | For automotive parts that use the Host Command Interface, this plug-in allows the user to compose and issue host commands. |
| InterestPoint.dll | This plug-in implements the detection of Interest Points, and allows the user to control various configuration parameters. |
MacbethOverlay_Plugin.ini | An initialization file for the Macbeth color overlay dialog plug-in (see below). |
MacbethOverlay_Plugin_SMPTE.ini | An initialization file for the Macbeth color overlay dialog plug-in (see below). This file supports SMPTE color charts instead of Macbeth charts. |
macbeth_overlay.dll | Dialog plug-in for color analysis using the Macbeth and SMPTE color charts. |
| PresenceDetection.dll | For the SOC1040 (MT9M114) and SOC2340 (AS0260), this plug-in is used to demonstrate the sensor's ability to detect ambient light and if a person is present. |
| RgbIR4x4Pipe.dll | For AR0237IR, subtract IR for strong IR light sources. |
| STEDlg.dll | For AP0100/AP0102/AP0200 parts only, generates transforms that will eventually be burned in to Flash memory. |
| SystemCurve.dll | For AP0101 parts only, generates gamma (ALTM), gamma, ALTM, and linear data for the given scene. |
| uart_transport.dll | TransportDLL for parts that have a UART. |
2.2.2 Toolbar Buttons
The toolbar is displayed across the top of the application window, below the menu bar. The toolbar provides quick access to many tools used in DevWareX.
To hide or display the Toolbar, choose Toolbar from the View menu (ALT-V, T).
| Detect | Detect Devices - same action as "File→Detect Devices". Find all sensors attached to the PC. | |
Info | Open or close the Info Dialog. The Info Dialog(See 2.2.5) contains an information window, Display Format choices and the current Mouse Selection choice. | <F2> or <Ctrl-I> |
Control | Open or close the Sensor Control Dialog(See 2.2.4). This set of pages gives access to a variety of image sensor registers through a user friendly interface. | <F3> or <Ctrl-S> |
Preset | Open or close the Preset Dialog(See 2.2.6). This dialog can be used to load or save the current state of the sensors (registers and color pipe settings). | <Ctrl-P> |
Register | Open or close the Register Dialog(See 2.2.7). The Register Dialog allows the user to read and write registers on the image sensor. | <F4> or <Ctrl-R> |
| Warn | Open or close the Register Overwrite Dialog. User Guide is here. | |
Log | Open or close the Register Log Dialog(See 2.2.8). This dialog logs sensor register writes. | <Ctrl-L> |
Graphs | Open or close the Analysis Dialog(See 2.2.9). The Analysis Dialog displays a graphical interpretation of a selected area of the display. | <F5> |
Magnify | Open or close the Magnifying Glass(See 2.2.10). Allows user to magnify a section of the display window. | |
Image | Opens the Image Navigation(See 2.2.11) window. Useful for navigating an image whose output size is larger than display area. | |
Watch | Opens the Watch Dialog(See 2.2.13) that allows the user to monitor volatile registers by re-reading them at a set time period. | |
Options | Opens the Options Dialog(See 2.2.15). | |
Play | Start displaying the image stream. | |
Pause | Pause the image stream. | |
Stop | Stop displaying the image stream. | |
Reset | (Soft) Reset the sensor to the power-on-defaults. This option loads the [reset] section from the appropriate .ini file. | |
Init | Load the initialization register settings for the sensor. The register settings can be found in the [Demo Initialization] section from the appropriate .ini file. | |
Full Auto | Enable the default software color processing options. | |
Preview | Toggle the sensor between Preview (viewfinder), snapshot mode, and for sensors that support it video mode via a pull-down. | |
Grab | Capture the displayed sensor image to hard disk or cancel an image capture. | <F9> |
| Lock | For sensors that support it, simulates half-press of a camera shutter to lock auto-functions such as AE, AWB, and Auto Focus. | |
Snapshot | Capture the "full resolution" image to hard disk or cancel an image capture. | <Ctrl-F9> |
Record | Records the image stream to hard disk. A Power-Point remote clicker's page-down and page-up buttons can be to start/stop recording when the PC is equipped with the IR interface. | <F8> or page-down = record start page-up = |
In | Zoom in on the displayed image. | <F10> |
Out | Zoom out on the displayed image. | <F11> |
Full | Displays the image in a full screen mode. This feature supports the following standard display modes: | <F12> |
Bug | Generates a bug report that collects information directly related to the camera setup which is useful for debugging. | |
Home | Opens the ON Semiconductor homepage (http://www.onsemi.com/) in your browser. |
2.2.3 Display

This area is where the sensor images are displayed.
If an image is not displayed here (when expected), please refer to the troubleshooting(See 2.2.17) pages.
Note that processed video streams, such as JPEG and H.264, will be slower than Bayer or RGB due to Software-based processing.
These same types of video streams will also have some "lag" (delay), again to due to the Software-based processing. This is most notable with H.264.
Images and Videos can be loaded for viewing, either by drag-and-drop method, or via the "File" menu via "Open Image or Video File".
Most image and video types can be viewed, including 32-bit BMP file format. See the Sensor Control dialogs of "Image Save Options" and "Video Record" for specifics.
Use the mouse wheel to zoom in, including to the maximum zoom level to see each pixel value:

To see the MIPI Virtual Channel (VC) and Data Type in use:
- Navigate to the "Options" Dialog (See 2.2.15) and enable "No Pixel Decoding (Pure Raw)" for the programmed bit-depth.
- Using the mouse wheel, zoom in all the way to see the pixel values and look at column 0.
You will see: 
The VC number is displayed first ("vc0") and then the MIPI Data Type in hex ("2C").
2.2.4 Control Dialog (Sensor Control)
This is the main control page. The dialog provides a set of tab pages that give user friendly access to logically grouped sensor registers or color pipe state settings. To access the registers directly use the Register Dialog(See 2.2.7)
The available tab pages depend on the type of image sensor you are using.
SOC Image Sensor Control Pages (See 2.2.4.4)
AP010x Sensor Control Pages (See 2.2.4.3)
SOC JPEG Image Sensor Control Pages (See 2.2.4.5)
Bayer Image Sensor Control Pages (See 2.2.4.2)
All sensors also share the following pages:
Capture Sensor Control Pages (See 2.2.4.6)
Diagnostics Sensor Control Pages (See 2.2.4.7)
There are also other pages available for most parts, and are simple to use.
HDMI Output
For Demo3 only, enable/disables the HDMI output port.
Focus Assist
SW implementation of a focus score. This "score" is a relative value, having no meaning other than a higher value indicates a crisper image focus.
The focus score is calculated as;
At each pixel in the ROI, the following filter kernel is applied to the pixel values:
0 0 -64 0 0
0 0 0 0 0
-64 0 256 0 -64
0 0 0 0 0
0 0 -64 0 0
Then take absolute value, and divide by the value of the center pixel. (Pixels of value 0 are skipped.)
Add the results for all pixels in the ROI.
Select the "Enable Audio FeedBack" check-box, and then select "Keep Going" (a "Ping") and "Switch Directions" (a "Buzzer") to hear the sounds that will be issued.
You can either us the "Universal Auto Focus" plug-in to manually focus the module, and physically focus it.
Image Orientation
Set flip/mirror of the image.
2.2.4.1 Developer-only Pages
There are some pages that are only available in our internal version (available only to ON Semiconductor employees).
Diagnostics/Noise vs. Exposure
This page will evaluate noise and exposure over a given number of frames.
If you want to measure the effect of a particular image processing function on noise level, then manually activate that function. To measure noise at the output of the sensor, turn off all image processing, except black level.
Also, make sure auto is disabled, and integration time set to a predefined value, and make sure software gain set to 1.
And in both cases, select "Raw Bayer Color".
For "'Raw Bayer Color - Sensor Output", disable all DevWareX ColorPipe options.
Bayer Bypass/SW FRF Advanced
This page implements a Flat Region Filter using Sigma, Edge, and Chroma thresholds..
Bayer Bypass/SW Green Balance
This page allows the user to enable Green Balance Correction for the DevWareX SW ColorPipe and adjust Highlights and Shadows.
Bayer Bypass/SW Black Color Kill
This page allows the user to enable Black Color Kill for the DevWareX SW ColorPipe and adjust its thresholds.
2.2.4.2 Bayer Sensor Pages
These sensor control pages are only displayed for Bayer sensors. For example, the: A-0360, A-0366, A-1300, A-1310, A-2010, A-3100, etc. For the most part, they control software image processing algorithms in DevWareX.
Note: The available sensor control pages and features depend on the type and version of the image sensor.
Data Interpretation Page
This page gives some control over the demosaicing algorithms that are used to convert the bayer image into an RGB color image.
For sensors with clear pixels (RCCB, RyyB, RGBC, RCCC), use "RGB (fast-linear)" to convert to a viewable RGB image.
This setting interpolates each of the four channels to get R, G1, G2, and B for each pixel. It then averages G1 and g2 together to get G. The result is RGB for each pixel.
SW Color Correction Page
The software color correction page allows the user to enable several digital image processing features to enhance the image.
Exposure Page
The Exposure page allows the user to change the Exposure and gain settings for the image sensor.
SW Auto Exposure Page
The Auto Exposure page allows the user to change the Auto Exposure and some noise related settings.
High Dynamic Range
For sensors that support High Dynamic Range, settings for data format, and noise reduction and tonal mapping. Details can be found here.
Triggers
For sensors that support triggers from Demo3 or an external source. Details can be found here.
SW White Balance Page
The white balance and color correction algorithms allow the application to regain color characteristics from the Bayer image beyond simple interpolation. More Color Correction controls can be found on the SW Color Correction page (see above), and see Gray Checker for usage information.
Lens Correction or SW Lens Correction Page
On sensor with built-in lens shading correction circuits this page lets you calibrate the lens shading registers. On sensors with no lens shading hardware this page enables a software lens correction algorithm. The calibration data can be saved to a file, or on some demo headboards an EEPROM on the headboard.
SW Noise and Defects Page
Algorithms for improving image SNR and automatically removing defective pixels.
The High/Low Algorithm can be combined with one of the Average-Near, Adapting Average-Near, or Flat Region Fliter algorithms.
Mouse-over each algorithm for a detailed description of its operation.
A Temporal Depth of "-2" will perform 2 Frame differencing.
Output Size Page
For selecting the sensor output window, skip mode, bit depth and other settings that affect the size and format of the output image.
Binning Page
The use of binning mode can reduce the impact of aliasing introduced by skip mode usage.
2.2.4.3 AP010x Sensor Pages
These sensor control pages are only displayed for the AP010x Companion Chips. Note: only the differences between the AP010x page and the SOC page are listed - SOC Sensor Control Pages(See 2.2.4.4).
Hue PCR
This page gives some control over the Hue and Saturation. Select a rectangular region, wait for ROI sampleing to complete, and then adjustments can be made.
Gamma Curve
A custom Gamma Curve can be set via interpolation between the user-supplied 32 points for the X axis, and then adjustment of the Y axis.
Color Kill
Adjustments to Color Kill can be made for the 3 zones using SNR and/or Gain.
Zoom Pan Control page
Available on on AP0101AT/CS, controls for sensor readout window and image reduction.
2.2.4.4 SOC Sensor Pages
These sensor control pages are only displayed for SOC sensors. Note: The available sensor control pages and features depend on the type and version of the image sensor.
Data Interpretation Page
This page gives some control over the way the sensor data is interpreted for the display.
Auto Exposure Page
Sensor auto exposure features. For a detailed description of these register settings please refer to the developers guide or the register specification document.
Exposure Page
This page is provided to allow manual control of exposure and analog gain of the image sensor. NOTE: Besides Auto Exposure there are two more algorithms that have the ability to influence the exposure registers. To be absolutely sure that the sensors exposure registers stay untouched the user should also disable Auto White Balance and the Auto Flicker Detection registers.
White Balance Page
Primary auto white balance controls. Note: This page may not be available on some sensors.
Gamma page
This page allows the user to set the registers for gamma correction and related controls. Gamma correction allows for correcting the voltage input signal distortion by the monitor. The gamma correction value is typically converted into a gamma curve that is approximated by a piece-wise linear gamma curve on the sensor. Please refer to the developers guide or the sensor specification document for detailed information about the gamma curve algorithm.
Enhancement page
Extra image color saturation and sharpening controls. Newer sensors adjust these settings automatically according to lighting conditions.
Lens Correction page
This page is for calibrating and possibly fine-tuning the lens correction registers on an SOC sensor. When tuning lens correction you should have the camera aimed at a uniform white or gray target, and turn off auto exposure, auto white balance and gamma correction so they don't interfere with the calibration. Tuning lens correction is more complex than it appears, and a full treatment of the subject is beyond the scope of this document.
Effects Page
The effects page simulates photographic film exposure techniques used in the darkroom to manipulate light in creative ways.
Context Control Page
Controls for setting image format and other settings independently for Preview and Capture modes.
Zoom Pan or Auto Zoom Control page
Controls for sensor readout window and image reduction. Not available on all sensors.
2.2.4.5 SOC Sensor JPEG Image Pages
These sensor control pages are only displayed for SOC sensors with JPEG capability. The available pages and features depend on the type and version of the image sensor.
JPEG Page
Controls for JPEG color format and compression settings.Note: for best JPEG decoding performance, enable JPEG "restart markers" on the SOC.
Thumbnail Page
Controls for activating and selecting the size of embedded thumbnail images.
Q Table Page
Manual control of the quantization table. Normally you do not need to adjust the table, the firmware on the sensor will control the quantization tables.
SOC Sensor Control Pages(See 2.2.4.4)
2.2.4.6 Capture Pages
Click on the "Control" button on the menu bar. The Sensor Control window will display. There are several dialog pages for setting Capture options.
There are two distinct modes of still capture. In the Current Displayed Image mode the still capture only freezes the currently displayed image and lets you save it to a file. No sensor registers are affected.
In the Full Resolution Image mode DevWareX will perform a still capture procedure on the sensor. It could involve changing the image size, using global shutter mode, activating a flash lamp and so on. On an SOC it would involve activating the still image sequence on the sensor.
Still Image Format
The software is transport-independent and supports parallel, HiSPi, and other interface types that don't even have a byte-wise representation.
MIPI is byte-wise, but the FPGA on the Demo3 parses the MIPI stream and unpacks the pixels. There is no way to get the MIPI stream exactly as it comes from the sensor.
RAW still files are always 8-bit, 16-bit or 32-bit per pixel. If the bit depth is not one of those values, then the smallest format big enough to hold the data is chosen and the data is in the least significant bits
This is how the data normally comes across from the device driver, and also has the advantage that it's easy to read with various software libraries and tools (Matlab, numpy, etc.).
For 20-bit depth, each pixel occupies 4 bytes, stored LSB first. The pixel value is in the 20 low bits.
For compressed formats, our software by default expands the pixels before saving the RAW file, so the RAW file has linear data.
2-byte covering 12-bit words: (1 2 3 4 5 6 7 8) (9 10 11 12 0 0 0 0)
4-byte covering 20-bit words: (1 2 3 4 5 6 7 8) (9 10 11 12 13 14 15 16) (17 18 19 20 0 0 0 0) (0 0 0 0 0 0 0 0)
Snapshot Page
Select various options related to still image capture. Note that "Average into One Frame" does not work with JPEG output format. The Average is pixel-wise temporal mean.
Image Save Options Page
This dialog is used to set the various image save options that are available.
The "Save Options" selection allows the user to select the type of data to be written to files. Raw Data is the unprocessed data coming from the sensor, which will be in the format the sensor is outputting, for example Bayer or YCbCr data. The Processed Data is RGB output data which has been converted from Bayer or YCbCr by DevWareX. The image will also include any of the image processing pipeline that has been enabled. The Processed Data can be saved in either a 24bpp Bitmap file or 48bpp TIFF file. By default the register information is saved in the accompanying .TXT file.
Also available are the options on where to save the images. Note; if both "Auto File Name Increment and Save" and "Hold Still Image in Main Window" are disabled, the "Grab" and "Snapshot" will not be able to actual provide images to save.
After a Still Image is captured, the "Filmstrip" dialog appears if the "Hold Still Image in Main Window" option is selected. This dialog shows thumbnails of the captured image(s). The user can then right-click on the image for various options, including opening the image for view, saving the image, and selecting the type of image.
"Save Mouse Selection Rectangle Only"; only the saved image will show the rectangle-only - the filmstrip will show the full image.
Note: Overlays (Watch and/or Embedded Data) will not appear on a .raw image. Instead, they will appear on RGB-type image formats.
Reg Capture Page
This advanced feature allows the user to record the state of specific registers when performing a still image capture. A single register or a range or registers can be selected at once and added to the list. Multiple entries can be added to the list and each can be grouped into custom named categories.
Normally, when the Capture button on the Toolbar(See 2.2.2) is pushed and the "TXT (registers)" option is checked on the Save Options page a "capture####_info.txt" file is created. This file contains a variety of information, among which is the entire sensor register state at the time of the capture. For some purposes this may be more information than is necessary. The Reg Capture page allows the user to record only the register states they are interested in during the capture and simplifies subsequent locating or viewing within the .txt file.
Reg Capture appends any user defined categories to the end of the .txt file. To ease viewing and reduce the filesize, the user can remove the full register state dump. Expand the General category in the list box and uncheck the "All Registers" entry. By default this option is enabled (checked).
Video Record Page
To capture a video stream press the Record button on the Toolbar(See 2.2.2).
NOTE: If Capture to RAM is unchecked, video is streamed directly to disk. The performance will depend on the speed of the hard disk and could result in dropped frames.
NOTE: The video formats are uncompressed and will take a significant amount of hard disk space.
NOTE: If Preview is disabled then the Color Pipe functions are skipped while live frames are accumulating. There will be no AE, nor any other Color Pipe processing.
You can save data in MPEG-4, AVI (2GB limit), WMV, or RAW format. RAW format requires no image processing and usually takes less disk space. If you don't have a compatible WMV codec installed, you'll be prompted with a URL to download one when you select that format.
You can also save data as "PNG Raw Files" or "PNG RGB Files", which is the ability to save a video as a sequence of PNG files in either Raw or RGB format. Note that Raw only supports Bayer or similar (not YCbCr).
You can use WMV instead of AVI for unlimited file length. DevWareX does not use compression with AVI. Usually the codec is just RGB-24. WMV is compressed in software.
- There is a frame rate value stored in the wmv file. There is a check box and numerical entry on the Sensor Control -> Video Record dialog page where you can provide a frame rate to put in the file. If that is not checked DevWareX uses the Display FPS.
- But that value comes from before recording started. During recording there could be considerable disk overhead or compression overhead so that the actual frame rate during recording is lower than it was before recording started. In that case the frame rate in the file will not match the actual frame rate of the recording.
The compression quality for MPEG-4 or WMV recording can be controlled with the "VidCap Quality" STATE variable.
Recording to H264 converts the original stream to RGB, and encodes to H264. If the original stream is H264 then it will do a decode and encode.
If the original stream is H264 and you want to just record that directly then record as RAW.
RAW video files of 10-bit, 12-bit or 20-bit pixels are packed to conserve space. 10-bit is packed four pixels to five bytes, 12-bit is packed two pixels to three bytes, and 20-bit is packed two pixels to five bytes. The packing is like this:

The end of each image row is padded up to the next byte boundary if needed.
Note: to record without compression, on Sensor Control -> Video Record, unselect "Packed".
If the sensor supports Companding, use Sensor Control → Video Record "Decompand" to enable/disable it.
How to record Recording high resolution video without dropping frames
- Record to RAM - usually your best option.
Under "Video Record" select "Record to RAM on the PC, then save to file".
You can then choose one of the 3 options on what to do when RAM is full - most useful option is "When RAM is full, write to disk and stop".
To find the maximum amount of RAM available, enter "Resource Monitor" in the search bar.
At the bottom is "Available", in MB. It is recommended to use no more than 80% to 90% of this value in the "RAM buffer size" field.
- A PC with an SSD may be able to record at-speed to a file. When recording to a file you will get the best recording frame rates by recording in RAW format and turning off preview while recording.
Some additional helpful info;
- RAW files will play back in DevWareX, but will need to be converted to AVI to be imported into other applications. You can use DevWareX as a RAW to AVI file converter. Load the RAW file in DevWareX and verify that the image looks correct. On the Video Capture dialog page select AVI recording format and turn off Capture to RAM. Click the Stop button on the Toolbar(See 2.2.2). Click the Record button on the Toolbar(See 2.2.2).
- The "Frame rate" listed in the info.txt file (RAW only) is the rate displayed on the Info Panel "FPS (Display)".
A specific frame rate can be set via Sensor Control / Video Record "Specify playback frame rate", or via the INI file using the STATE commands "VidCap Auto Play FPS" and "VidCap Play FPS". - “Specify playback frame rate”; DevWareX video playback speed is not precise.
- MPEG-4 requires at least 20 frames to be recorded.
Single Button Image Capture
To enable the ability to perform a single-button image capture, do the following;- On the "Snapshot" page, enable "Camera Sound Effects". - On the "Image Save Options" - Use <F9> (for a "Grab") or <Ctrl-F9> (for a "Snapshot") to capture an image with a single button.
2.2.4.7 Diagnostic Pages
Noise Measurement Page and Noise vs. Exposure
User Guide can be found here.
The Noise Measurement tool runs a series of noise analysis computations, and reports signal levels and different kinds of noise measurements.
After the analysis completes, the results are displayed here in plain text, tab-separated format.
Measurement is performed on linearized data. This enabled HDR noise measurement and removes dependence on most ColorPipe states.
Image Data Type Selection
SOCs and ISPs; Raw YCbCr means the YCbCr data (the output of the SOC/ISP) is analyzed. "RGB (Processed)" means the RGB data (what you see on the monitor) is analyzed.
Bayer sensors; Raw Bayer Color means the data directly from the sensor. "RGB (Processed)" means the RGB data (what you see on the monitor) is analyzed.
Configuration
Auto functions may adjust gain or exposure while the noise measurement is in progress, therefore you should disable auto functions while doing noise measurement. If you want to measure the effect of a particular image processing function on noise level, then manually activate that function. To measure noise at the output of the sensor, turn off all image processing, except black level.
Reporting
The report window supports editing, so you can add notes if desired. You can cut-and-paste the data from this window into Excel.
There are seven columns of data in the analysis results report:
- RMS Dyn - Root-Mean-Square Dynamic (temporal)
- Avg Dyn - Average Dynamic (temporal)
- FPN - Fixed Pattern Noise
- Col FPN - Column-wise Fixed Pattern Noise
- ColLFPN - Column-wise Local Fixed Pattern Noise
- Row FPN - Row-wise Fixed Pattern Noise
- RowLFPN - Row-wise Local Fixed Pattern Noise
- Col Dyn - Column-wise Dynamic
- Row Dyn - Row-wise Dynamic
A report will look something like this:
Noise Levels (std. dev.) Signal Full Range = 255
Channel Signal RMS Dyn Avg Dyn FPN Col FPN Row FPN Col Dyn Row Dyn
Y 128.0 0.674 0.669 0.340 0.112 0.218 0.540 0.546
Cb 127.9 0.672 0.669 0.389 0.184 0.116 0.227 0.278
Cr 128.6 0.505 0.502 0.282 0.101 0.079 0.200 0.213
The formulas for the calculations are as follows. The noise measurement process captures N frames of W x H pixels, creating a 3-dimensional data set of W*H*N pixel values. Pixel values are denoted as
p(x, y, i) wherex = 0 .. W-1y = 0 .. H-1i = 0 .. N-1
Define also the following intermediate values:
pavg(x, y) = [Σ p(x, y, 0..N-1) ] / N
σ(x, y) = sqrt( [Σ (p(x, y, 0..N-1) - pavg(x, y))2 ] / N)
h(y, i) = [ Σ p(0..W-1, y, i) ] / W
h(y) = [ Σ p(0..W-1, y, 0..N-1) ] / (W*N)
v(x, i) = [ Σ p(x, 0..H-1, i) ] / H
v(x) = [ Σ p(x, 0..H-1, 0..N-1) ] / (H*N)
The analysis results are calculated as follows:
Signal = [Σ p(0..W-1, 0...H-1, 0..N-1) ] / (W*H*N)
RMS Dyn = sqrt( [Σ σ2(0..W-1, 0..H-1) ] / (W*H) )
Avg Dyn = [Σ σ(0..W-1, 0..H-1) ] / (W*H)
FPN = sqrt( [Σ (pavg(0..W-1,0..H-1) - Signal)2] / (W*H) )
Col FPN = sqrt( [Σ (v(0..W-1) - Signal)2 ] / W )
Col LFPN = same as Col FPN except Signal is calculated from the nearby columns only, instead of the whole analysis area.
Row FPN = sqrt( [Σ (h(0..H-1) - Signal)2 ] / H )
Row LFPN = same as Row FPN except Signal is calculated from the nearby columns only, instead of the whole analysis area.
Col Dyn = sqrt( [Σ ( v(0..W-1, 0..N-1) - v(0..W-1) )2] / (W*N) )
Row Dyn = sqrt( [Σ ( h(0..H-1, 0..N-1) - h(0..H-1) )2] / (H*N) )
Fuse ID Reader Page
The Fuse ID Reader page is used to get and save the Fuse ID information for each sensor, by reading register combinations specific to each sensor and saving this information.
Sensor Advanced
This dialog allows for override of settings that DevWareX usually determines on its own via reading sensor register settings.
- Sensor; these check-boxes control hard-wired lines from the Demo3 to the sensor; Power, Reset, and Shutdown.
- Sensor Clock Speed; sets the Input clock speed from Demo3 to sensor headboard (assuming the headboard is jumpered for external clock), and Array clock.
- Use the "Apply" to set the values, and "Detect" to display the current settings.
- Sensor Base Address; use "Detect" to discover the current I2C value, and the pull-down and then "Apply" to assign a new value (where applicable).
- Color Filter Array (CFA); displays the current CFA, and use the pull-down to force the DevWareX ColorPipe to use this CFA.
- Sensor Output; use "Detect" to discover the current width/height and pixel format, and "Apply" to set new ones.
- Check-boxes; use these to change the pixel order/format.
DEMO3
Gives you access and control to features of the baseboard. - The onboard oscillator can be set via the XMCLK field. The "Image Buffers" select the type of buffering used by the Demo3. And "GPIO Pins" allows the enable / disable and level (on/off).
Serial Receiver
This dialog controls the various settings of the image sensor output format to the Demo3. The actual controls are self-explanatory as it assumes the user knows these advanced settings.
2.2.5 Info Dialog
The Info dialog appears at the left edge of the DevWareX window and displays information about the image sensor, the frames displayed and the mouse position. Additionally, it has list box controls to change the mouse selection area (for use with the Analysis Dialog(See 2.2.9)) and to select between multiple sensors (only appearing if more than one sensor is attached).
Property fields:
Sensor | The ON Semiconductor Imaging sensor being used (only appears if value is different than "Part Number"). |
Part Number | The ON Semiconductor part number for this sensor. |
| Family | Will appear when a sensor is a member of a "family" of sensors (e.g., Hyperlux). |
Sensor version | The version of the image sensor. |
Sensor type | Either 'Bayer' or 'SOC' sensor. |
| Die Temp. | Die Temperature. |
| Interface | Sensor output type; Parallel, MIPI, HiSpi, etc. |
Software: | |
Build name | The version and type of build (either Release or Beta). |
Build version | The full version number (major.minor.revision.build) of the DevWareX application. |
Build date | Date the software was compiled. (MM/DD/YYYY) |
Demo Board: | Type of Demo board being used (for example: DEMO3). |
| Input Clock | The sensor's input clock (in MHz). |
Array Clock | The oscillator frequency being used (in MHz). |
Output Clock | The pixel clock output as calculated by DevWareX based on the specific configuration of the attached device. Array Clock is nominally the sensor array clock. It's the clock used to calculate row time, exposure time, etc. Normally, the clock rates are re-measured when a PLL register is changed. Depending on the demo kit configuration, it may not be possible to measure the clocks from software. Demo2X can measure PIXCLK if the sensor is streaming in parallel mode. Demo3 can measure Input Clock if it is hooked up to the Demo3 clock sense line. Once one of the clocks is measured, the other two can be calculated from the PLL settings. The clock speed on the Options dialog sets the Array Clock value (in case DevWareX can't measure it), and Pixel Clock and Input Clock will be automatically calculated according to the PLL settings. |
Width | The pixel width of the displayed sensor image. |
Height | The pixel height of the displayed sensor image. |
Image Type | The current sensor image format (for example 'YCbCr', 'Bayer 8', 'Bayer 10', etc.). |
| Size (bytes) | Size of image data, in bytes. |
Frames | A frame counter that gets increased for each displayed sensor image. |
Dropped frames | Dropped frames are possible under the following circumstances:
|
FPS (Sensor) | The computed number of Frames Per Second that the sensor is running at based on register settings and oscillator (see Clock above) value. |
FPS (Datalink) | The number of Frames Per Second that the camera sends to the host computer via USB (or other data link). This number can be influenced by the speed of the computer, or the host controller and drivers. |
FPS (Display) | The number of Frames Per Second that are displayed on the computer. A camera frame is first converted from its native format (see above) to a 32bit RGB image and finally converted to the display adapter's resolution (preferably also 32 bit). Software image processing can slow down the display frame rate. The display frame rate is also affected by the host computer's display drivers. The Accelerated selection on the Options(See 2.2.15) dialog can help. |
Cursor pos | The mouse cursor position when the mouse is over the display area. Expressed as a positive (width, height) value relative to the upper-right most pixel (0,0). |
Raw Data | The unprocessed sensor data at the mouse cursor position. For SOC sensors the data is separated into Y, Cb, and Cr values. For Bayer sensors there is a single data value, with the Bayer color pattern position indicated in parentheses (R, Gr, Gb, or B). |
R: Output | The value of the Red component of the displayed image at the mouse cursor position. |
G: Output | The value of the Green component of the displayed image at the mouse cursor position. |
B: Output | The value of the Blue component of the displayed image at the mouse cursor position. |
Mouse Selection (used in conjunction with the Analysis Dialog(See 2.2.9)):
Off | No area selected. The whole image is used for analysis. |
Rectangle | Only the selected rectangle is used for analysis (typically used with the analysis-histogram graph). |
Column | Only the selected column is used for analysis (typically used with the analysis-intensity graph). |
Row | Only the selected row is used for analysis (typically used with the analysis-intensity graph). |
Point | Only a single point is used for analysis (typically used with the analysis-noise graph). |
Press and hold the left mouse button (while over the Display(See 2.2.3) area) to change the selection area.
2.2.6 Preset Dialog
This dialog can be used to load or save the current state of the sensor registers and color pipe settings. This information is stored within an .ini file which is loaded for each version of the sensor. For example, the file for the AR0544CS-REV1 would be located in C:\Aptina Imaging\apps_data\AR0544CS-REV1.ini.
All sensors have a 'Demo Initialization' preset. Bayer Sensors typically have a 'Color Processing ON' and 'Color Processing OFF' Preset as well.
INI files are plain text and can be edited by the user.
To copy the name of a Preset, do a single-left-click of the Preset and then CTRL-C.
See the INI File Users Guide for more information about ini files and the command syntax.

INI file and optional Initializer: Location of main INI file on first line, and optional location of Initializer file (for those sensors with separate Python-settings files).
Preset Actions: various actions available for the loaded INI file.
- Open: open an additional INI file. Same operation as available in "File / Open Additional Presets ..."
- Edit: edit the INI file, using the edit application associated with ".ini" files.
- Edit Initializer: edit the Initializer file (when present), using the edit application associated with ".py" files.
- Note: notepad.exe will be used if no edit application is associated with ".py" files.
- Reload: reread the INI file - to be used if "Edit" or "Edit Initializer" have modified their respective files.
- Default: go back to the default INI file - the INI file associated with the loaded SDAT file.
- Load: will load and run the Preset highlighted in the "Presets" window.
- Rename: rename the selected Preset.
Note that the INI file is automatically saved, but does not need to be Reloaded.
Preset Name Search: enter search terms. Only preset names matching all terms will be shown.
Presets: displays all available Presets. Note that Dialog Settings "Options..." can be used to show "Hidden" presets.
Dialog Settings: various settings that are available.
- Warnings: Show the Register Overwrite Warnings dialog. Same operation as the "Warn" Toolbar.
- This will check for accidental overwrite of OTPM-trimmed registers, or other inappropriate register values.
- Checking this report should be part of the verification of any new mode presets.
- Options...: show "Hidden" presets.
- Guide: opens the on-line INI Users Guide.
2.2.7 Register Dialog
The Register Dialog allows the user to read and write registers on the image sensor. For a more user-friendly way to access registers use the Sensor Control Dialog(See 2.2.4) .
The drop-list box and tabs at the top of the Dialog (Sensor Core, Color Pipe, etc.) are used for sensors that have multiple address spaces/pages/register categories. To choose an address space, select it from the drop-list or click the appropriate tab. The tabs hold the six most recently used pages. Sensors with only one address space do not have any tabs.
To switch the Address or Value columns between hexadecimal and decimal format, click on the column header. The column's current value format will be displayed in parentheses.
This table describes the displays and controls under the Address Column;
| A writable register |
| A register with separate bitfields below it. Double click this button to collapse the bitfields for this register. |
| A register with bitfields that are hidden. Double click this button to expand the display for the bitfields for this register. |
| A read-only register. |
| A bitfield for the register immediately above it. |
| Hide all the register bitfields in the register list. |
| Show all the register bitfields in the register list. |


If a Display Name is red, it indicates that it is confidential.
If a Value is red, it indicates the value is different from its default.
2.2.8 Register Log Dialog
This dialog logs the values that are written to the sensor registers. All registers are logged regardless of whether they are written with the Register Dialog(See 2.2.7) or Sensor Control Dialog(See 2.2.4) . The log information is in the same format as the .ini file. You can select, cut, and paste from this dialog to an ini file. For example:
REG=1, 0x12, 0x3FEF // DEFECT_BUF_WRITE_PORT2 [2]
means that the value 0x3FEF was written to register 0x12 in address space 1. The [2] means that this register was written 2 times and that the latest value written was 0x3FEF.
2.2.9 Analysis Graph Dialog
The Analysis dialog displays a choice of real-time analysis graphs that allow the user to view some simple characterization schemes for the image sensor.
- Use the Mouse Selection(See 4.4) tool to select which pixels to analyze.
- Image type can be selected via the Radio buttons on the left, as are Colors, and optionally Axis minimums and maximums.
- Right-click on the graph to various data presentation options.
- Left-click on the graph to create reference lines.
- To save the graph image to a BMP file, right-click on the graph and select Save Graph Image As....
Intensity
The Intensity graph displays the intensity (on the vertical-axis) of each of the selected pixels (horizontal-axis). Right-click on the graph for more options. To save the intensity data to a file (tab-separated text) right-click on the graph and select Save Graph Data As.... The Intensity graph only works when you use the Mouse Selection tool to select a Row, Column or Rectangle (for use with diagonal measurement).
The X-axis represents the actual pixel being measured. Row and Column Means require a Rectangle (or Off to use the entire image as the Rectangle).
Note; when using Row on a Bayer image, two rows are used so all four channels.
It plots an even rows and an odd row, so if on on even row it adds the row below, and if on an odd row it adds the row above.
Histogram
The Histogram collects the total amount of pixels (vertical-axis) for each of the possible intensity values (horizontal-axis) for each of the color channels. The histogram is taken over the currently selected area and works best for a small rectangular selection(See 4.4).
Right-click on the graph for more options. To save the histogram data to a file (tab-separated text) right-click on the graph and select Save Graph Data As....
When the histogram is being displayed, if you right-click on the graph and select Show Control Window the following Analysis Graph Controls are available.
By default the histogram data is displayed in Combined RGB mode. The Analysis Graph Controls can be used to display a luminance graph as well. When displaying a luminance graph the user has the option to display additional data characteristics.
The graph calculates approximate mean from the histogram. So the precision is limited by the size of the histogram bins. That's why it says " ~161 ". Likewise for the other statistical calculations on the graph.
Noise
The Noise graph shows the intensity (vertical-axis) of a single pixel for each frame for all color channels. The old values remain so an intensity-over-time (horizontal-axis) graph appears. This display wraps around and shows approximately 640 time slices. The text at the top display computed temporal SNR in dB. (If there is no fluctuation in the data, the readout shows 0.0.)
Additional Data displayed;
The equation for each is the same, but each column (or row) is only compared to the average of the five columns (or rows) before and after it, instead of to the whole image. This prevents uneven lighting from adding to the noise value.
Note: this only works when using "Point" as the mouse selection. If something other than Point is selected, then Noise works on the upper left corner of the selected area.
Vectorscope
The Vectorscope graph shows the distribution of the chrominance signal in the selected area. You will need to aim the camera at a color reference chart.
NOTE: DevWareX only uses 8-bit output for Bayer Sensors by Default. To switch to 10-bit output, go to the 'Sensor Output' Bayer Image Sensor Control Pages (See 2.2.4.2)
2.2.10 Magnifier
Right-click anywhere in the display(See 2.2.3) area to magnify the pixels at that location. A window will appear showing the magnified pixels. A green rectangle on the main image indicates what portion is being magnified. The Magnifier window can be resized and the level of magnification can be adjusted by the scroll bar on the right side.
2.2.11 Image Navigation
This window shows the entire current image output (as indicated in the Info Dialog(See 2.2.5) pane). The viewable portion of the image, that which fits into the current display area, is shown within a red box. Note: If the display area can accomodate the entire image, you will not see a red box.
This feature is useful for image outputs that are larger than the current display area. It allows for navigation by right-clicking or right-clicking and dragging within the Image Navigation window. Either action will cause the main display area to adjust the field of view accordingly. The Image Navigation window may be resized or relocated for convenience.
For example: If your sensor output is 1024x768, but you can only see 640x480 at any given time, the Image Navigation window will show the full 1027x764 image. The current 640x480 viewable area is indicated by a red-box and this portion can be moved by clicking within the window.
2.2.12 Peek & Poke
Directly access a registers on any I2C controlled device on the DEMO system. For sensor registers, using the Registers panel is preferred.
NOTE: This tool is provided for developers who have a good understanding of the sensor specifications. Using this tool might make the application unstable because it allows for changes of data size from the sensor that the application is unaware of. Please be cautious when changing the address space selector (page register) with this tool.
2.2.13 Watch Dialog
The watch page allows the user to monitor volatile registers by re-reading them at a set time period.
Adding Registers to Watch
There are three ways to add a register to "Watch".
- By right-clicking on a register (or bitfield) item in the Register dialog, then choosing "Add to Watch" from a popup menu.
- By right-clicking on a register (or bitfield( item in the Log dialog, then choosing "Add to Watch" from a popup menu.
- By using the Save/Load button to load a previously save watch list. DevWareX remembers your watch list when it exits and restores it when it starts up again.
Record to csv File
During monitoring, user can also record register values to a csv file. The number of entries per second is sensor frame rate.
Save/Load (Watch REG Preset Dialog)
The Watch REG Preset Dialog can be used to load a "watch" preset defined in an .ini file or to create a new "watch" preset to an .ini file. This allows the user to save and load the watched registers between sessions. The default .ini file used for the presets will be used for the watch presets. Another .ini file can be selected using the Browse button. All the preset names in list box will be pre-appended with "Watch REG:" in the .ini file to differentiate them from standard presets.
Watching Registers on the Demo3
Watch assumes register addresses refer to the sensor.
You can still monitor it on the Watch dialog using the Python function feature.
On the Watch dialog click Non-Register…, click Next, for def put MipiFrameCRC, in the box put
return demo3.MipiFrameCRC.value
(including the leading spaces). Then click Test Function, click Finish.
2.2.14 Embedded Data Viewer
Enable decoding and dislaying of the SMIA register data (not available for SOC sensors).
Record to csv File
- Browse... - Select the file/path for the .csv file.
- Start - Begin recording to .csv file.
SMIA Register List Control
Right click anywhere in the list window in order to copy the selected lines into the clipboard or in order to disable or enable the registers that are going to be overlayed on the image.
Overlay Style
- Embedded in image - Overlay status, CRC and/or SMIA registers in image data.
- Floating in Image Viewer - Overlay status, CRC and/or SMIA registers over the image view so that the text size will adjust to the Zoom level. Overlayed data in this manner will not be saved along with image data.
Embedded SMIA data
- Decode Embedded Data - Select to enable decoding of embedded data. SMIA data is embedded inside of the captured image.
- Overlay Data on Image - Select to overlay the embedded data on the image.
Overlay Checksum
Enable I2C CRC overlay in the image data/view.
Title
Allows the customer to add a title to the data overlay.
2.2.15 Options Dialog
This dialog is for miscellaneous items including user interface options, error logging functions, and high-level sensor overrides (clock speed, I2C base address and image data format).
Most fields have "Tool Tips" that can be scrolled-over for usage and INI file information.

- Display: selects the display format - for remote display of DevWareX select "No DirectX" and zoom increment.
- Log FIle : enables various types of logging output, from DevWareX internal errors to USB traffic.
- Warning Dialogs: reset just the Warning Dialogs setting (re-enables them). Use "View→Warning Log" to see all warnings.
- Detect Bad Frame Sequence: enable/disable the all-frame dropping warning message.
- Debug Settings : enables debugging of displayed images.
- Show Dropped Frames : very useful in displaying images that aren't in the expected format, or corrupted frames such as JPEG.
- Miscellaneous : various settings that could be enabled or disables as seen in the figure above.
- Reset All : resets all settings to their defaults.
2.2.16 Warning Messages
When a warning message box appears the application has:
- hit an unexpected result.
- come upon an area where continuing might lead to unexpected results.
If presented with a choice we strongly recommend that the user follows the direction the warning message box suggests.
If the warning message box is unexpected please refer to the trouble shooting guide.
2.2.17 Troubleshooting
When the program does not behave the way intended, or you experience problems that are not covered in the help files you may wish to file a bug report(See 2.2.18) .
Check to see if any of the following sections help with the problems you encounter.
I have problems starting the application and see one of the following warning message boxes: 
-> Check if the USB drivers are installed properly. Refer to the driver installation document under "Start>All Programs->Aptina Imaging->Docs->User Guides->USB Drivers User Guide".
--> Check if the cables are attached to the image sensor properly. If the image sensor worked before, unplug-and-plug the cables and try again. 
--> Check if the application is started from the same place that holds the sensor_data directory (holding the sensor data(See 4.5) files)
The application starts without errors, but there is no image:
--> Some register settings might lead to stop the sensor from sending valid data. Quit the application and reset the sensor by unplugging it and plugging it back in.
My frame rate is really low:
--> The amount of data that is being processed is quite significant or a lot of image processing function are turned on. Reduce the size of the image on the Output Size or Context page of Sensor Control. On the Options dialog, select the Accelerated Display option. Turn off extra image processing.
When setting registers the application freezes up:
-->Changing registers on the image sensor might lead to changes in the data flow resulting in unexpected lockups of the application. Terminate the application as best as possible and reset the sensor by unplugging it and plugging it back in.
2.2.18 Reporting a Bug
- If the trouble shooting(See 2.2.17) pages did not help solve the problem you are having you may wish to email a bug report as follows:
- In DevWareX, go to the menu Help -> Bug Report or select the picture of the "bug" from the toolbar.
- Provide as detailed as possible a bug description (mention bug symptoms like 'no image', 'distorted image', etc.)
- Provide information on how to reproduce the bug (what registers did you change, what buttons did you press before the bug showed up, etc)
- Copy the contents of the system information window to the clipboard by pressing the Copy to Clipboard button.
- Start an email and paste (Ctrl-V) the clipboard contents of system information into the text portion of the email. Edit this information as you see fit, see the note below.
- Send the email to Aptina-IMAGING_DEMO_BUGS@onsemi.com.com
NOTE: The system information that is gathered to help us solve the problems you encountered consists of the following sections: Application version info, Camera info, Windows Operating System info, Processor info, USB Host Controllers info and Image Sensor Register settings. The application only gathers this information and does not send anything. Please look through the information and edit it as you see fit before emailing it.3. About ON Semiconductor's Developer Suite
The following list provides details about folders of interest installed in C:\Aptina Imaging
Folders:apps Applications that use specialized libraries apps_data
.INI files for ON Semiconductor sensors
board_data
Data files for ON Semiconductor demo boards
capture
Storage location of DevWareX captured images
DevWareX Files specific to DevWareX.exe doc
Documents, schematics, and BOM's
drivers USB drivers and User Guide firmware
Demo board firmware files
flashtool
Flash Tool for automotive products
fpga
Demo board FPGA files
include
Include files for imaging applications
imageformats Image format .dll files lib
ON Semiconductor Imaging library (midlib) files
Plugins
DevWareX plug-in files
samples
Sample imagine application code
sensor_data
ON Semiconductor sensor data (.SDAT) files
"Start Menu" Index
Here is a list of folders and their contents, that are accessible from the Windows Start menu.
Folders:Docs
Start->All Programs->Aptina Imaging->Docs
Links for all documentation and schematics.SDK
Start->All Programs->Aptina Imaging->SDK
Links provided to sample applications to help users develop their own imaging applications.Tools
Start->All Programs->Aptina Imaging->Tools
Links for tools such as HardwareUpdate, RegPoke, Flashtool, etc.)3.1 HardwareUpdate Tool
This is a Window's application that updates the firmware and FPGA code on the ON Semiconductor Imaging baseboard (Demo2X or Demo3). The tool is located in: Start menu -> All Programs -> Aptina Imaging -> Tools .
Usage and Tips
- A complete User Guide is available under the "Start" menu, via Docs -> User Guides.
- Launch the tool, then follow the on-screen instructions when the Hardware Update Wizard appears.
- The Chooser page will allow you to select between checking for firmware or FPGA code updates. It is recommended to check/update the firmware first.
- DO NOT unplug the USB cable during the programming process as it may render the board useless.
- After any programming has be performed, it is necessary to close the HardwareUpdate Tool and detach/reattach the USB cable to the baseboard. If this is not done, the HardwareUpdate Tool will not reflect recent programming changes. When updating both firmware and FPGA, it will be necessary to do this after each update. I.e. update firmware, close tool, detach/reattach USB, then update FPGA, close tool, and detach/reattach USB.
3.2 SideBySide Application
This application allows two ON Semiconductor Demo cameras to be simultaneously displayed side-by-side. It is useful for comparing differences in equal sized sensors, although dissimilar sensors may also be used together. Synchronous control of both images is provided for panning, zooming and play-state.
Usage and Tips
- Connect two Aptina Imaging Demo cameras to the system. Make sure the cameras are recognized and the drivers are installed.
- Launch SideBySide from the desktop shortcut. The application will automatically start two instances of DevWareX and size the display windows evenly. The initial startup takes a little more time than normal, but requires no user interaction. Please be patient.
- All DevWareX toolbars and dialogs are hidden by the application. They can be manually re-enabled if access to a specific control is needed.
- Selecting Quit from the SideBySide control bar will close all DevWareX instances, it is not necessary to close each one separately.
4. Addenda
4.1 Command menu commands
Play | Start displaying the image stream |
Pause | Pause the image stream |
Stop | Stop displaying the image stream |
Reset | (Soft) Reset the sensor to the power-on-defaults. This option loads the [reset] section from the appropriate. ini file. |
Initialize | Load the recommended register settings for the sensor. The recommended register settings can be found in the [Demo Initialization] section from the appropriate. ini file. |
Full Auto | Enable the recommended software color processing options |
Preview mode | Toggle the sensor between preview (viewfinder) and snapshot mode. |
Check Sensor | Re-evaluate the current state of the sensor. This can help you recover from a situation where DevWareX is dropping all frames. |
4.2 File menu commands
Open Sensor Data File | Open a specific sensor data (SDAT) file for the current sensor. |
Open Image or Video File | Open an image file and display the image, instead of a sensor. |
| Recent Sensors / Images | Show a list of the most recent SDAT and image files. |
| Refresh Register List | Reopen a specific sensor data (SDAT) file for the current sensor(Using file browse). |
Open Default Presets | Open an INI file as the default presets file. (same as the Browse... button on the Presets dialog). |
Open Additional Presets | Open an INI file as an additional presets file. This INI file will not affect the dfault presets file, and it will not be used to specify the actions of the DevWareX toolbar. |
Probe for Devices | Re-run the device probe that will determine what sensor you have attached and automatically select the right SDAT file. |
Capture Image | Capture the currently displayed sensor image to hard disk <F9 >. |
Take Snapshot | Capture the sensor image to hard disk <Ctrl-F9 >. |
Record Video | Record the image stream to hard disk Note: the video is uncompressed and will take significant hard disk space. This mode is for characterization only. |
Exit | Exit the application. <Alt-F4>. |
4.3 Help menu commands
The Help menu offers the following commands, which provide you assistance with this application:
Help Topics | Offers you an index to topics on which you can get help. |
| Tutorial Videos | Points to our YouTube channel. The video support link is https://www.youtube.com/user/AptinaDeveloper/videos |
Bug report | When you find a problem with this software, please file for a bug report by following the information in the Bug Report Dialog. |
| System Dump | Opens system information in Bug Report pop up window. |
| Performance Overlay | Performance log is displayed as overlay on the image or view finder. |
| Performance Dump | Performance Dump is displayed as part of overlay |
| Check for updates | Displays the latest DevSuite daily build that could be installed |
| Internet Home Page | Opens the page http://www.onsemi.com/ |
About | Version and copyright information. |
4.4 Mouse Selection commands
Off | The whole display area is selected. |
Rectangle | A rectangular area is selected. Hold down the left-mouse button and drag the cursor around in the display to make your selection. This is specifically useful for the Analysis-History graph |
Column | A single column is selected. Hold down the left-mouse button and drag it around to select the column. This is specifically useful for the Analysis-Intensity graph . |
Row | A single row is selected. Hold down the left-mouse button and drag it around to select the row. This is specifically useful for the Analysis-Intensity graph . |
Point | A single point is selected. Hold down the left-mouse button and drag it around to select the point. This is specifically useful for the Analysis-Noise graph . |
The Mouse Selection coordinates are in terms of the rows shown on the screen only. If you hide some rows then 'last row' (from the Mouse Selection) will be less than the total number of rows from the sensor, 'height'.
This only occurs when you hide extra rows. In your table below the only case where you used the 'Hide' option is the right-most column, 'AR0220AT/hidden'. In all other columns you have not used the 'Hide' option, so the 'last row' is 'height' - 1.
Double-click "Mouse Selection" bar to open the dialog that allows setting of up to 8 unique mouse configurations. Also see "Lock Mouse Selection", here.
Summary
Not using 'Hide' option: 'last row' = 'height' - 1
Using 'Hide' option: 'last row' = 'height' - number_of_hidden_extra_rows - 1
Whether the sensor outputs embedded data rows is different from whether DevWareX hides them.
Sensor | AR0132 | AR0132 | AR0220 | AR0220 |
Emb. Data on | on | Off | On | On |
Emb. Data hidden | Unhidden | Unhidden | Unhidden | Hidden |
Height | 964 | 960 | 980 | 980 |
Last row | 963 | 959 | 979 | 947 |
Height - last row | 1 (unhidden) | 1 (unhidden) | 1 (unhidden) | 33 |
4.5 Sensor data (.XSDAT) files
The sensor data files with extension .xsdat hold information about the registers of each of ON Semiconductor image sensors. These files are used to auto-detect the image sensor that is attached to the computer.
NOTE: The application expects the sensor_data directory to be in the same directory from where the application is started.
A detailed description of the SDAT files can be found here.
4.6 View menu commands
Toolbar | Show or hide the Toolbar(See 2.2.2). |
Status Bar | Show or hide the Status Bar that appears along the bottom of the DevWareX main window. This bar may provide brief infomation about the currently selected feature, status of various Caps/Scroll/Num lock keys, etc. |
User Toolbar | Show or hide User Toolbar below the menu bar. |
| User Toolbar 2 | Show or hide User Toolbar in the right side of DevWareX to enable adding desired shortcuts needed by user. |
| Plugins Toolbar | Show or hide Plugins menu(See 2.2.1.1). |
| Toolbar Labels | Show or hide labels for the options in the toolbar. |
| Rulers | Show or hide the pixel labels in the live video display. |
| Pixel Values in Hex | When fully zoomed-in in the live video display, show the pixel values in hex or decimal. |
Info Dialog | Open or Close the Info(See 2.2.5) Dialog . This dialog contains Demo System information, display format choices and the current mouse selection(See 4.4) choice. <F2> or <Ctrl-I> |
Sensor Control | Open or Close the Sensor Control(See 2.2.4) pages. This set of pages provides access to a variety of image sensor registers through a user friendly interface. <F3> or <Ctrl-S> |
| ColorPipe | Open or Close the ColorPipe dialog. User Guide can be found here. |
Preset Dialog | Open or Close the Presets(See 2.2.6) dialog. This dialog can be used to load or save the current state of the sensors (registers and color pipe settings). <Ctrl-P> |
Register Dialog | Open or Close the Register(See 2.2.7) Dialog. This dialog allows the user to read and write registers on the image sensor. <F4> or <Ctrl-R> |
| User Control | Create your own presets using a text editor, or various tools in DevWareX. User Guide can be found here. |
| Register All Access (Peek & Poke) | Opens the Peek & Poke(See 2.2.12) dialog. This dialog allows the user to quickly read or write registers by specifying specific addresses and values. |
| Register Overwrite Warnings | Open or Close the Warn Dialog. User Guide can be found here. |
Log Dialog | Open or Close the Register Log(See 2.2.8) Dialog. This dialog allows the user to view and log all the register changes that are happening. This could be useful when manipulating higher-level user interfaces on the Sensor Control pages. <Ctrl-L> |
Analysis Graphs | Open or Close the Analysis(See 2.2.9) Dialog. This dialog displays a graphical interpretation of a selected area of the display. <F5> |
Magnifier | Open or Close the Magnifier(See 2.2.10) window. This feature allows user to zoom a desired section of the display area. |
| Image Navigator | Open or Close Image Navigator Window. |
Watch | Open or Close the Watch(See 2.2.13) Dialog. This dialog allows the user to add individual registers and track their value in real time. |
| Captured Images | Opens or closes captured images window showing the images captured in the particular instance of DevWare. |
| Python Console | Opens the Python console where commands could be entered. |
| Debug Console | Opens Debug console. |
| EEPROM Presets | Opens EEPROM Presets console. |
| Warning Log | Opens the Warning Log Dialog. |
| Mouse Selection Area | Opens the Mouse Selection Dialog. Allows for selecting up to 8 different mouse selection configurations. |
| View Sensor Data File | Opens the sensor data file for the connected sensor. |
Zoom in | Zoom in on the display image. <F10> |
Zoom out | Zoom out on the display image. <F11> |
Full Screen | Switches the display into FullScreen Mode. To return back to windowed mode, hit any key. <F12 > |
Options | Open or Close the Options(See 2.2.15) Dialog. |
| Center All Dialogs | Use when switching between different sized monitors and dialogs are positioned off the screen. |
Open or Close
Opens the Peek & Poke(See 2.2.12) dialog. This dialog allows the user to quickly read or write registers by specifying specific addresses and values
4.7 Gray Checker
Problem Description
One of the most widely used methods of sampling pixels for AWB statistic is white-point estimation method, when we take only pixels which are close to white-points curve for given sensor. White-points curve can be defined in different coordinates. Most wide used coordinates are B/G vs. R/G, Log(B/G) vs. Log(R/B), Y vs. X, (R-B)/Y vs. (R+B-2G)/Y
Fig.1 demonstrates Log(B/G) vs. Log(R/G) diagram for each GretagMcBeth color squares. Series number corresponds to McBeth color square number. B/G and R/G ratios were calculated for row data received after applying unity analog and digital gain to each color channel at four different color temperatures covering temperature range from 2800K to 6500K. Series 19-22 were received from gray McBeth chart zones and define white-points aria.

White-points aria has to be specified for certain sensor and every pixel considering for WB statistic has to be tested for belong to the white aria. The given document describes method estimating distance from any point in 2-D space (current pixel) to white-points curve specified in this space by piece-wise linear curve. The given method is independent from type of coordinates and does not require a lot of resources for implementation.
Algorithm Description
The given algorithm describes method estimating shortest distance from certain point P0 with known coordinates [X0,Y0] in 2D space to piece-wise linear curve defined by set of nodes P1[X1,Y1], P2[X2,Y2], P3[X3,Y3], P4[X4,Y4].
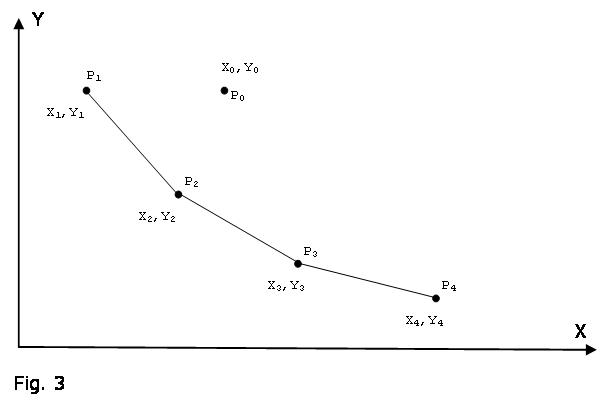
1. Define procedure DIST(A,B) which estimates the distance between points A and B. If point A has coordinates [Xa,Ya] and point B [Xb,Yb] equation defining distance between these two points is DIST(A,B) = SQRT[(Xa - Xb)2 + (Ya - Yb)2]. Implementation of this equation might be difficult and costly in RTL, therefore we use approximation which can be easily implemented and provides less than 10% error in distance detection.
1.1 dX = |Xa ? Xb|; dY = |Ya ? Yb|
1.2 D = dX + dY;
1.3 if (dX > dY) then
Min = dY;
Max1 = dX;
Max2 = dX / 2;
Max3 = dX / 4;
Max8 = dX / 8;
else
Min = dX;
Max1 = dY;
Max2 = dY / 2;
Max3 = dY / 4;
Max8 = dY / 8;
1.4 if (min <= max8)
DIST = D;
If (max8 < min <= max4)
DIST = D/2 + D/4 + D/8;
If (min > max4)
DIST = D/2 + D/4;
2. Calculate distance between point P0 and every node point P1, P2, P3, P4 using routine DIST(A,B) defined above.
Dis1 = DIST(P0,P1), Dis2 = DIST(P0,P2), Dis3 = DIST(P0,P3), Dis4 = DIST(P0,P4),And find two closest nodes to point P0.
3. Assume that two closest nodes to point P0 are P1 and P2 as shown on fig.3. Then we divide interval [P1,P2] into four equal intervals [P1,P3] = [P3,P4] = [P4,P5] = [P5,P2]
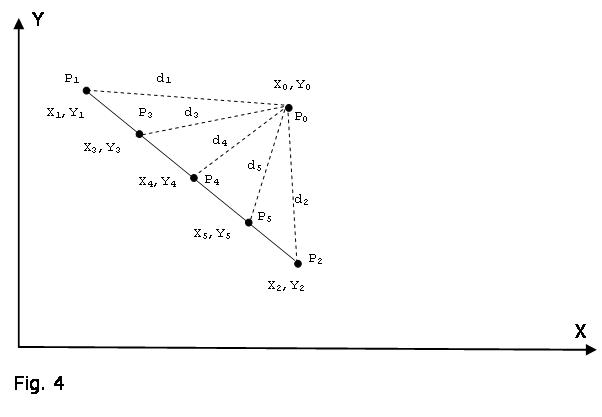
Coordinates for nodes P3, P4 and P5 will be defined as:
X3 = X1 + deltaX/4; X4 = X1 + deltaX/2; X5 = X1 + deltaX/2 + deltaX/4; Y3 = Y2 + deltaY/2 + deltaY/4; Y4 = Y2 + deltaY/2; Y5 = Y2 + deltaY/4;Where: deltaX = X2 ? X1 and deltaY = Y1 ? Y2
4. Calculate distance between point P0 and every node point P1, P2, P3, P4, P5 using routine DIST(A,B) defined above.
d1 = DIST(P0,P1), d2 = DIST(P0,P2), d3 = DIST(P0,P3), d4 = DIST(P0,P4), d5 = DIST(P0,P5),5. Minimal number among d1, d2, d3, d4, d5 is shortest distance between point P0 and piece-wise linear curve.
4.8 Documents menu commands
Data Sheets | Points to DataSheet Info page |
Developement Guides | Contains links to our various Development Guides |
DevSuite Quick Start Guide | Opens up DevSuite-Quick Start Guide.pdf . |
Hardware Documents | Points to various BOMs , Lens Drawings and Schematics. |
Miscellaneous | Has a sub option "Software License" which inturn opens up the software license as a word document. |
| Release Notes | Opens Release Notes.pdf pertaining the the release version in use. |
| User Guides | Contains links to our various User Guides. |
4.9 Edit menu commands
Copy Image | Copies image to clip Board. |
Edit Image in Aptina Viewer | Opens the image in Aptina Viewer to allow editing. |
Edit Raw Image in Aptina Viewer | Opens the Raw image in Aptina Viewer so that it can be Edited. |
Search Registers | Opens the Search Registers window to search for desired registers. |
Edit Default Presets File | Opens the preset file(corresponding to the sensor connected) in not pad to allow editing. |
4.10 DevWareX Register "Spying"
DevWareX spies on register writes, and if something that affects DevWareX changes, such as image format, then DevWareX adjusts automatically.
This includes writing to the attached device, any auxiliary boards (e.g. Dual Lane MIPI), and/or the basebase (Demo2X or Demo3).
This is normally what you want, but it can adversely affect test scripts.
To disable this spying (and all automatic register accesses), follow these steps;
- In the Options Dialog, unselect "Allow Register Spying" and "Allow Sensor Frame Rate Polling", and "Allow FAR register access" if present.
- In the Watch Dialog, clear all items via the "Clear All" button.
The INI commands to do the Option Dialog settings are;
OPTION = Reg Control, 0 // Disable Register Spying
STATE = Allow Update Sensor, 0 // Disable Allow Sensor Frame Rate Polling
STATE = Allow FAR Access, 0 // Disable Allow FAR register access