...
When the program does not behave the way intended, or you experience problems that are not covered in the help files you may wish to file a bug report(See 2.2.18) .
Check to see if any of the following sections help with the problems you encounter.
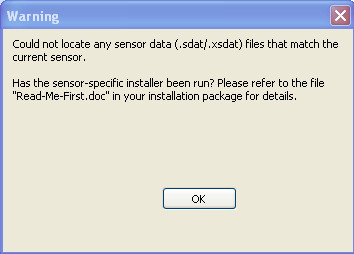
I have problems starting the application and see one of the following warning message boxes:
-> Check if the USB drivers are installed properly. Refer to the driver installation document under "Start>All Programs->Aptina Imaging->Docs->User Guides->USB Drivers User Guide".
--> Check if the cables are attached to the image sensor properly. If the image sensor worked before, unplug-and-plug the cables and try again.
--> Check if the application is started from the same place that holds the sensor_data directory (holding the sensor data(See 4.5) files)
The application starts without errors, but there is no image:
--> Some register settings might lead to stop the sensor from sending valid data. Quit the application and reset the sensor by unplugging it and plugging it back in.
My frame rate is really low:
--> The amount of data that is being processed is quite significant or a lot of image processing function are turned on. Reduce the size of the image on the Output Size or Context page of Sensor Control. On the Options dialog, select the Accelerated Display option. Turn off extra image processing.
When setting registers the application freezes up:
-->Changing registers on the image sensor might lead to changes in the data flow resulting in unexpected lockups of the application. Terminate the application as best as possible and reset the sensor by unplugging it and plugging it back in.
...
Fig.1 demonstrates Log(B/G) vs. Log(R/G) diagram for each GretagMcBeth color squares. Series number corresponds to McBeth color square number. B/G and R/G ratios were calculated for row data received after applying unity analog and digital gain to each color channel at four different color temperatures covering temperature range from 2800K to 6500K. Series 19-22 were received from gray McBeth chart zones and define white-points aria.
Fig.1 Log2(B/G) vs LOG2(R/G) diagram for GretagMcBeth colors received for A-3120 sensor.
White-points aria has to be specified for certain sensor and every pixel considering for WB statistic has to be tested for belong to the white aria. The given document describes method estimating distance from any point in 2-D space (current pixel) to white-points curve specified in this space by piece-wise linear curve. The given method is independent from type of coordinates and does not require a lot of resources for implementation.
...


